Offset-to-angle transformation
While data conditioning is usually performed in the offset domain, seismic impedance inversion is executed in the angle domain. Thus, offset-to-angle transformation is required, and performed with the help of velocity. There are two ways of obtaining the velocity field. One is to make use of the seismic velocity field obtained from processing of the seismic data, and the other is the well-driven velocity field generated using the sonic log curves. Besides lack of confidence in the estimated seismic velocity, its inconsistency with horizons picked on the stacked seismic data makes geoscientists somewhat reluctant in using it. Consequently, well-driven velocity is preferred. However, it needs to be ascertained if the velocity field generated with a single well and constrained with horizons is enough to represent the whole seismic survey, or more than one well is required for the purpose. Practically, though a multi-well velocity field is considered superior than a single well velocity field as it captures the complexities associated with unconventional plays, the interpolation of the velocity field between two wells is challenging as it can exhibit artifacts. Therefore, a workflow that uses both the seismic velocity and well velocity in building the final velocity field is proposed for offset-to-angle transformation and further analysis therefrom.

The angles of incidence computed using the seismic interval velocities (left) and well-driven velocities overlaid on seismic offset gathers. The sonic velocity curves have been overlaid at the well location. Notice that while the seismic velocities show an increasing trend, there are sharp changes in the angle of incidence at different points in time as seen on the display for angles of incidence generated using well data. (Adapted from Chopra et al., 2019)
Impact of velocity on AVA analysis:
Amplitude variation with offset or angle (AVO or AVA) has been widely used for discriminating hydrocarbons from brine saturated rocks. In actual practice, NMO-corrected prestack seismic data are conditioned for enhancing the signal-to-noise ratio and thereafter put through amplitude variation-with angle (AVA) analysis. As all mathematical formulation for AVA analysis is carried out in the angle of incidence domain, both the seismic driven velocity and the well driven velocity can be used to transform offset gathers into angle gathers. Thereafter, intercept and gradient attributes can be extracted and compared. As the intercept attribute is a function of just the impedance contrast at zero offset, no appreciable differences are expected to be seen on the intercept sections. However, as the gradient attribute is a function of the P-wave velocity, S-wave velocity and density, which in turn are a function of the various rock-fluid properties, significant differences may be seen between the gradient attribute computed using the seismic velocity field and the well-driven velocity field. In order to highlight the impact of velocity on AVA analysis we consider a data from the Western Canadian Sedimentary Basin(WCSB) as illustrated below.

A segment of the velocity field (a) seismic (b) well-driven around the location of the gathers. Angle information overlain on two offset gathers (c),(d) is also shown for both cases, respectively. Not only does the well-driven velocity field look more meaningful in terms of being horizon constrained and its correlation with individual intervals, the angle information derived from seismic velocities is higher than that derived from the well-driven velocities, as can be checked at the location of the white block arrows. In (a) the white arrow is well into the cyan color, and in (b) it is at the end of red colour. (Adapted from Sharma & Chopra, 2019)

An arbitrary line passing through different wells extracted from the AVO gradient volume generated when (a) seismic velocity, (b) well-driven velocity was used in the analysis. Notice the significant strengthening of the amplitudes in (b) as indicated with the colored arrows (green, cyan and yellow). Such amplitude differences can appreciably impact the derived reservoir properties and hence are important. (Adapted from Sharma & Chopra, 2019)

(a) Crossplot of AVO intercept versus gradient over the zone of interest when (a) seismic velocity, (b) well-driven velocity was used in the analysis. (c) When anomalous points on the crossplot are enclosed in a red polygon in (b) and back projected on the seismic section, they highlight the Duvernay zone, which is the source rock. (Adapted from Sharma & Chopra, 2019)
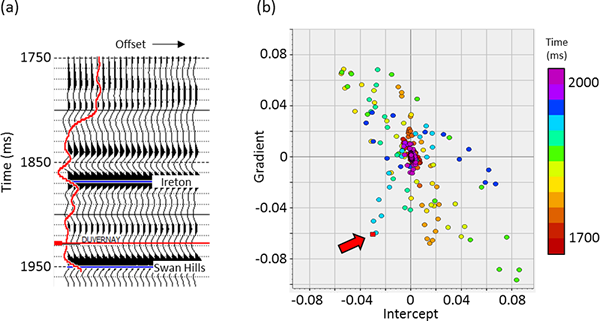
(a) AVO modeled elastic gather for a well that traverses the Duvernay formation of interest, (b) crossplot of intercept versus gradient attributes for the modeled gather. Notice, the outlier points (indicated with the red block arrow) resemble the points enclosed in the red ellipse in Figure b above (intercept/gradient crossplot). (Adapted from Sharma & Chopra, 2019)
References
Sharma, R. K., S. Chopra, and L. R. Lines, 2019, Impact of adequate QC steps on seismic reservoir characterization, presented at SEG Convention, held at San Antonio, in September.
Sharma, R. K. and S. Chopra, 2019, Impact of velocity field on AVA analysis, published in the AAPG Explorer, March’19 issue, 19, 23.